
⚡️ Mark Roberge's Guide To Revenue Growth
Revenue Hop #1
Hey there 👋 welcome to the 1st summary in this series. As a quick introduction to myself, my name is Barry Nyhan and I’ve spent the last couple of years working in SaaS Sales for Hypergrowth companies.
The reason why I’ve decided to start this newsletter is to help you build and execute your go-to-market sales strategy (and selfishly help me retain what I read and listen to). How we will do that is by curating and summarizing insightful content from the best revenue leaders to help you grow better.
We’re starting with one of my personal favourites, and I’d be going against my HubSpot roots if I didn’t start with the guy that helped grow Hubspot from $0 to $100 million revenue. Today’s summary is on Mark Roberge’s talk he gave at the annual SaaStr SF Bay Area conference in 2019 covering his step by step guide to revenue growth.
What we’re going to cover today:
Retention or Growth - Where Should You Focus Your Efforts To Scale
How Should We Measure Customer Value Creation
Aligning The Company Around Your Leading Indicator
Are You Scaling Too Fast or Slow
Look Under The Hood Before You Scale
Sales & Marketing Alignment With SLAs
How To Hire Your Ideal Sales Rep
Mark’s Sales Interview Framework While At HubSpot
What A Good Sales Coach Does
How To Build A Data Driven Coaching Culture
Using Sales Compensation To Retain The Best Talent
🎉 Pop Quiz
What’s the failure rate for a Series B Startup?
Mark kicks off the talk by echoing a daunting stat of 75%.
How about a Series C Startup?
Yep, it’s 75% as well. Why does he start with these stats? It’s because Mark believes we’re screwing up the scale, and he’s created a framework to help shift how we think about it.
🚀 Retention or Growth?
Rather than focusing on revenue growth with mediocre retention which seems to be the market norm, Mark advises that you flip the approach by focusing and ironing out your retention before going full throttle on new business.
The reason being, it’s much easier to grow once you know your retention is rock solid than to actually fix your retention problem while you’re scaling because you’d end up having to slow the business growth down to fix the retention challenges before you shift into Hypergrowth anyway.

Because startups haven’t checked the proper boxes, they end up thinking they have product-market fit, hire 20 sales reps to put gas on the fire, and 1 year later end up firing the majority of those people thinking they’re not as good as they sold themselves to be in the interview.
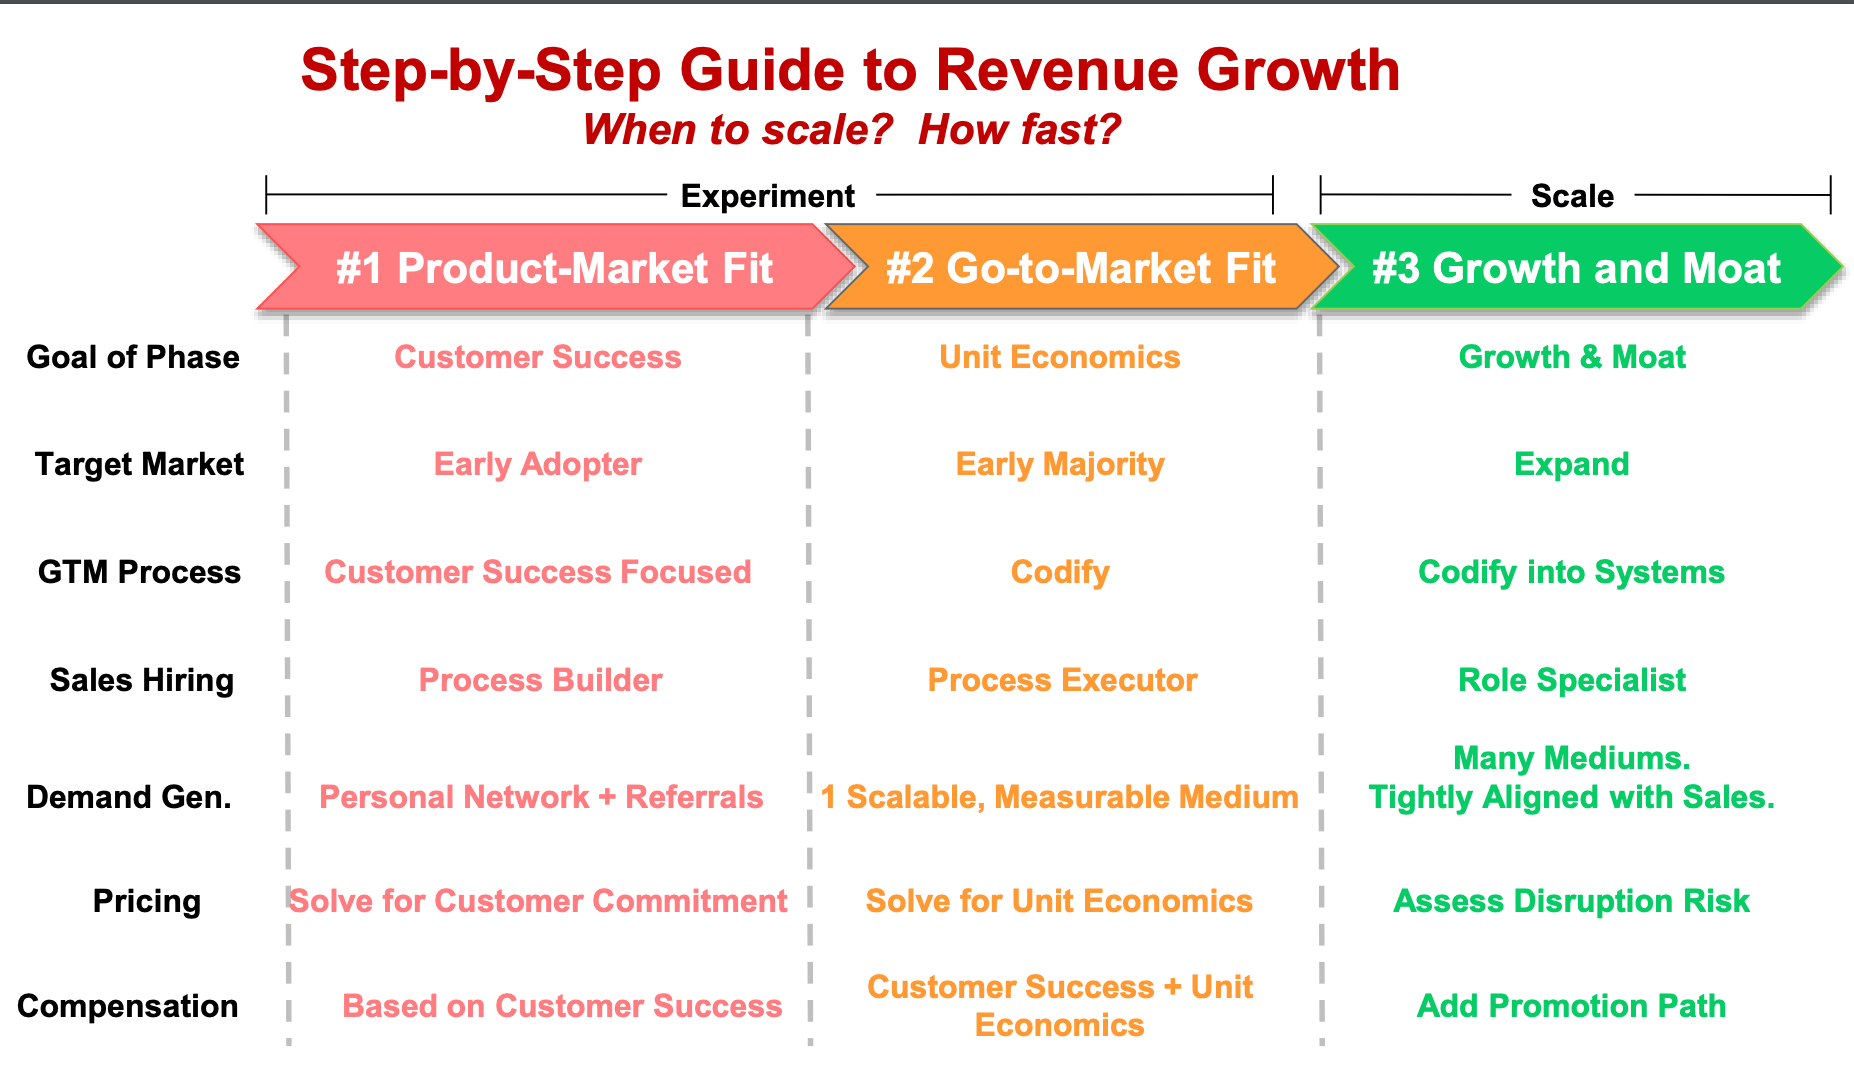
Here’s the formula we should be following instead:
Product-market fit measured by Customer Value Creation, progressing with Go-To-Market Fit measured by Unit Economics = Scale Fast

💡Measuring Customer Value Creation
But what is Sales all about?
Sales is about customer value creation where revenue is the outcome, not the other way around
So how do we measure customer success?
Do you measure it through revenue retention rates and logo retention rates?
This is a trap because churn is a lagging indicator and a silent killer. B2B SaaS is notorious for starting with annual subscriptions rather than month-to-month, but what if they’re only staying with you for that period of time because they’re locked in? If they had it their way, would they churn after 2/3 months?
We have to identify leading indicators to learn fast
For Slack it was when a team sent 2,000 messages
For Dropbox it was when 1 file was added to 1 folder on 1 device
For HubSpot it was using 5 of the 20 features within 60 days
Using leading indicators to measure customer success can cut your feedback loop down from 1 year to a number of weeks, and the entire process can be automated to make it easy to stay on top of.
This Should Be The First Slide In Your Board deck
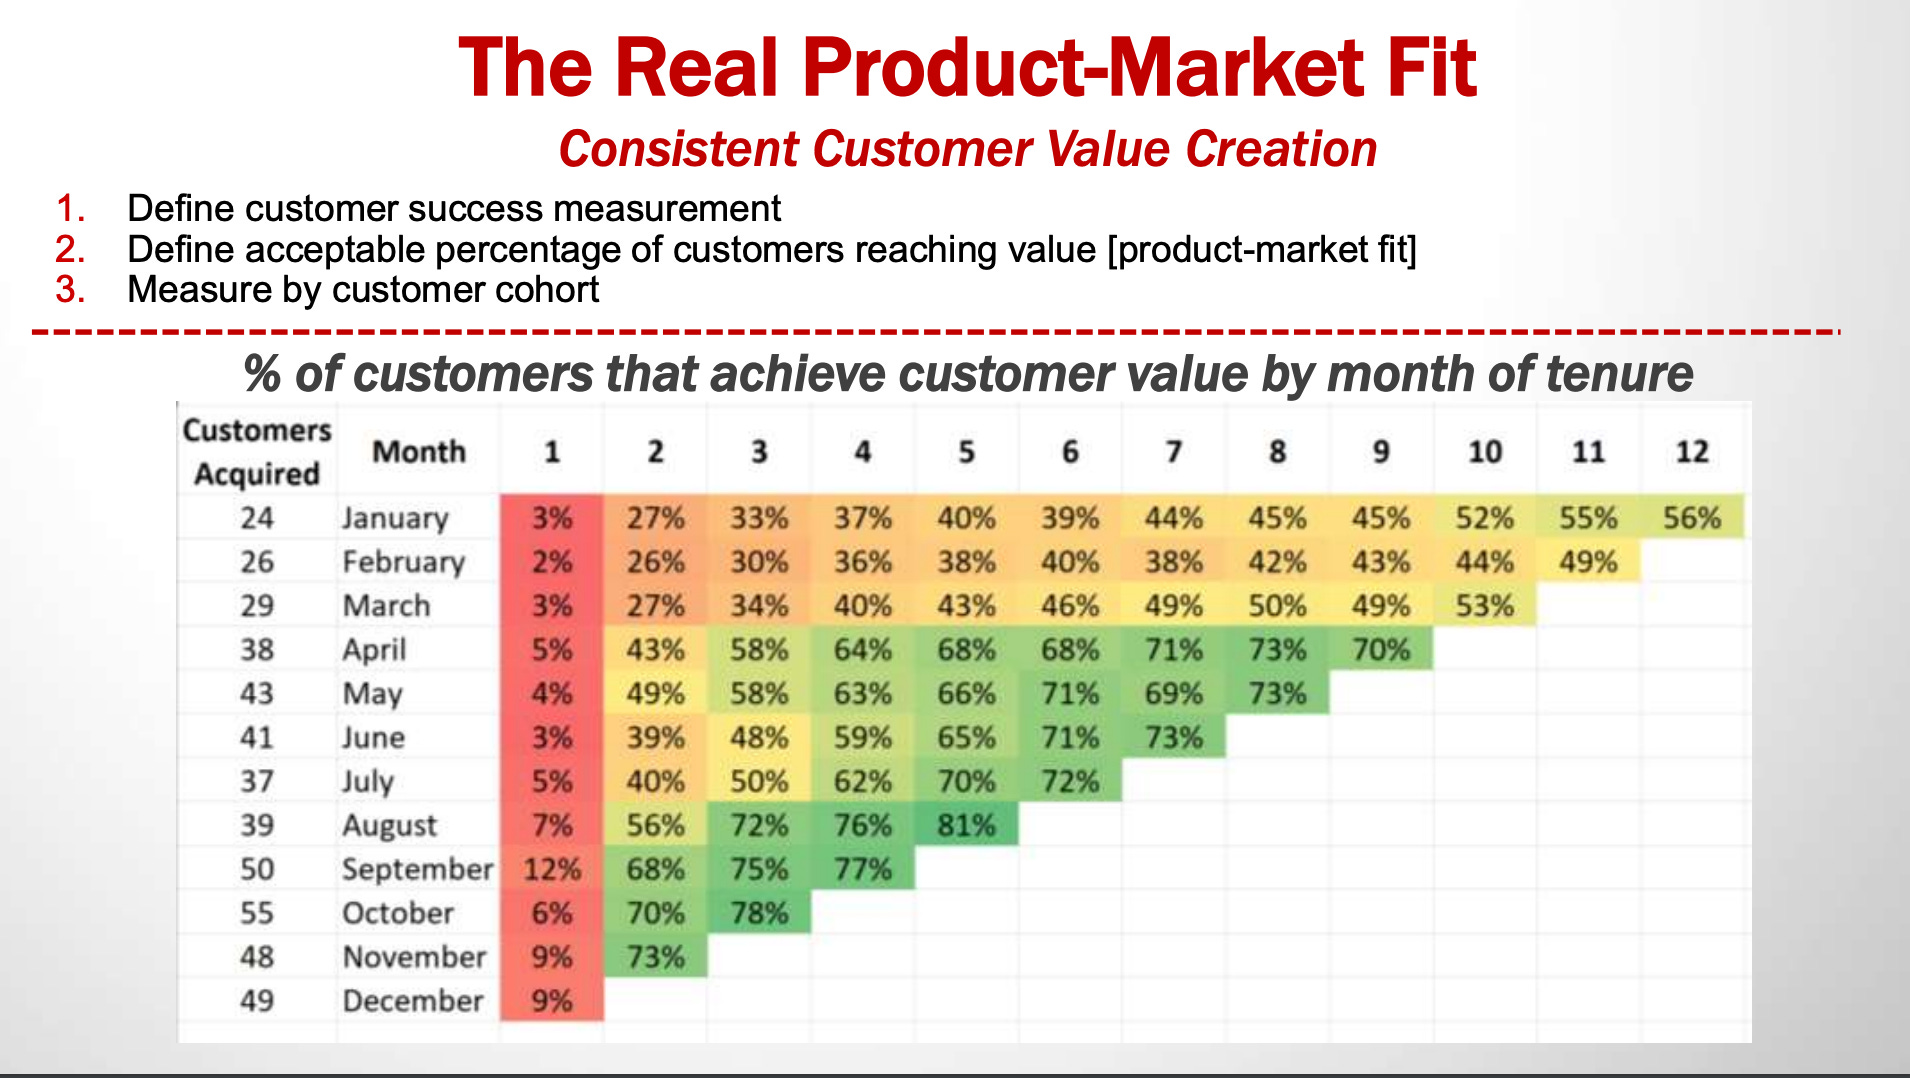
Whatever you decide on as your leading indicator, you should be measuring how many new customers reach that Aha moment each month.
This graph measures customer value creation, month over month, and tracks whether you’re improving or not through the experiments your team is running. This is how Mark believes we should quantify product-market fit and the goal is to have the graph all green. That’s when you know you have product-market fit.
🧲 Leading Indicator Alignment
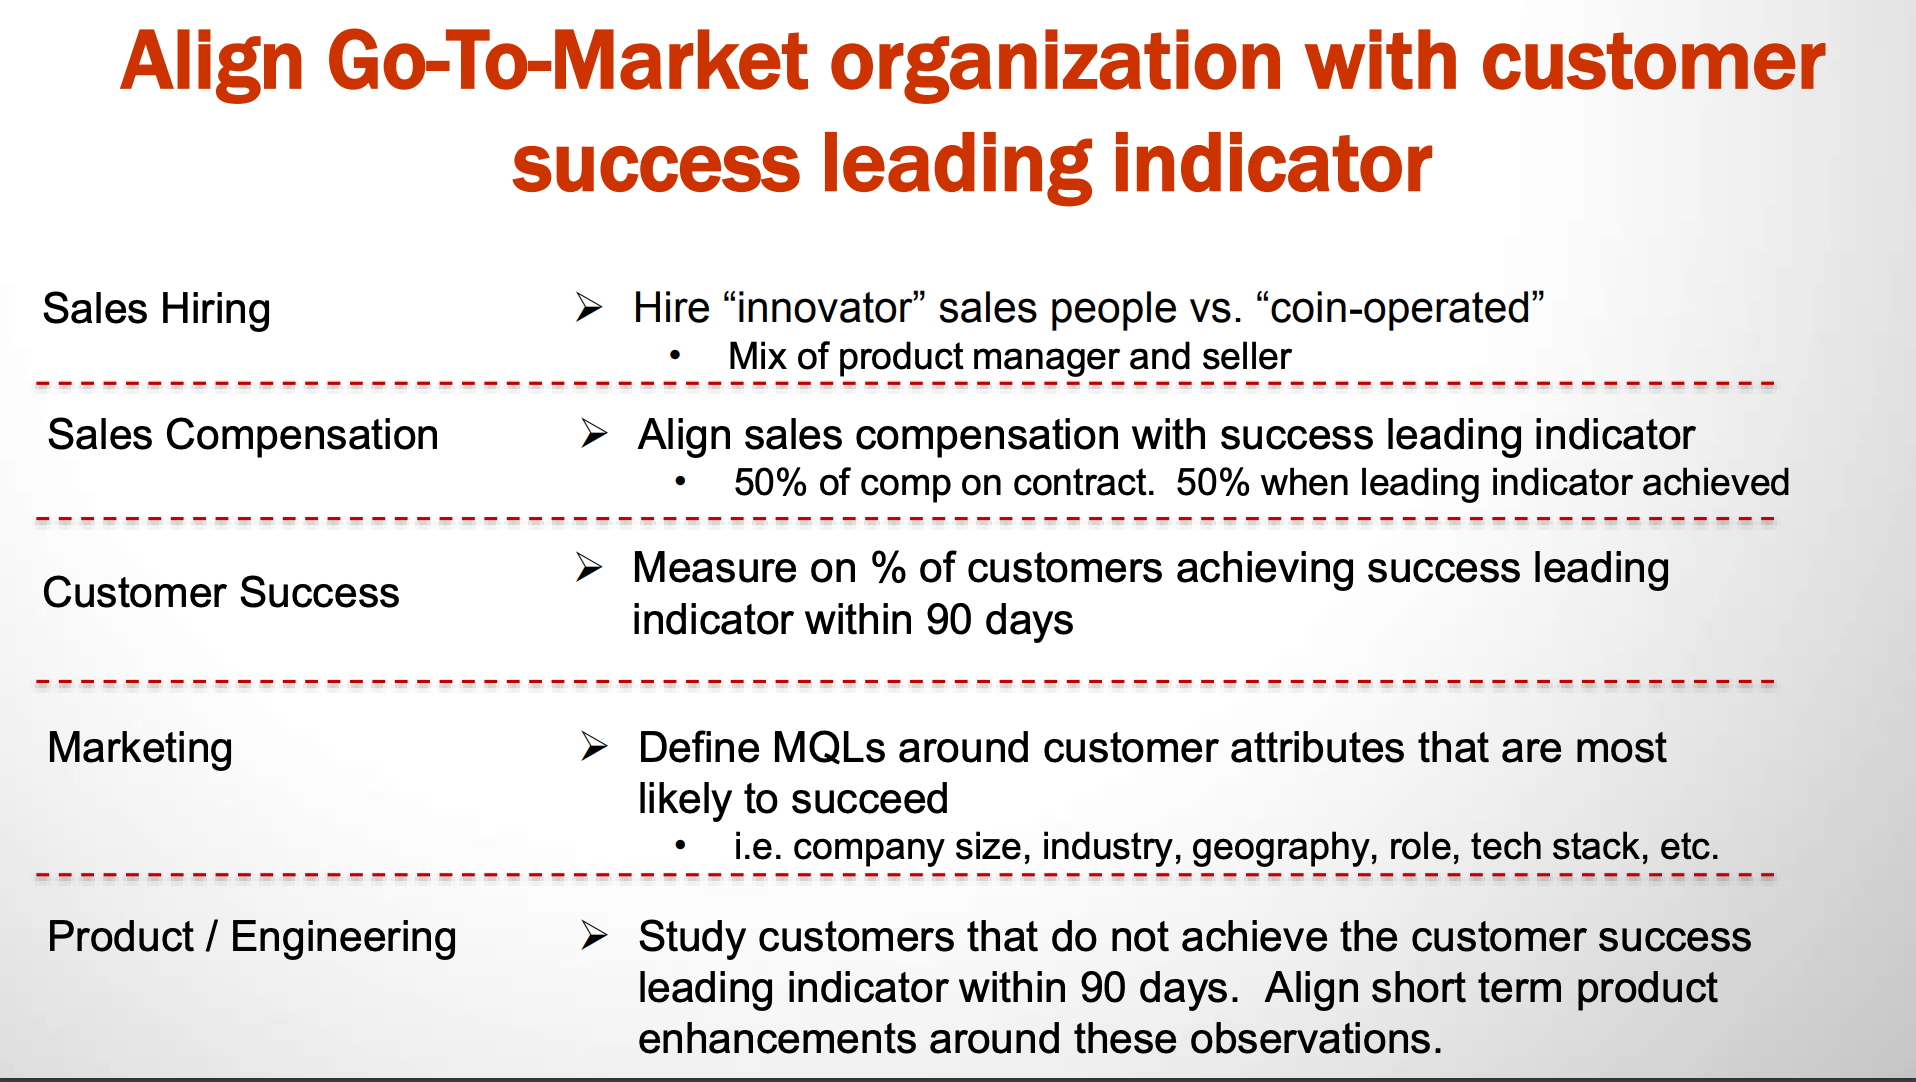
By now you have your leading indicators defined to measure customer value creation, and you have an acceptable percentage of your customer base reaching that value in their early tenure with you. It’s now time to focus on your go-to-market before it’s time to scale it up.
Here’s where you need to align your whole go-to-market around customer success and strive for the following unit economic benchmarks:
LTV / CAC > 3
Payback < 12 Months
⚡️Are You Scaling Too Fast Or Too Slow

Using the above speedometer you can clock whether you’re achieving both product-market fit, and go-to-market fit. Once you have that, it’s time to scale.
But scaling is not let’s hire 20 reps tomorrow to put gas on the fire.
Scaling is a pace. You should hire 1 rep every other month and keep an eye on your speedometer and how the unit economics and customer success measurables change.
After 6 months or so and if the measurable are still where we want them to be, then you can ramp it up to 2 reps or 3 reps a month. If the measurables are off and broken, then slow down and fix them.
This framework helps you avoid becomming one of those 75% of Series B and C companies that fails as a result of scaling prematurely
🚙 Look under the hood before you scale
Mark shares a story about a company that looked to be doing really well from the outside, was nailing their numbers, and ended up raising a round of funding to scale because they believed they had it all figured out.
What ended up happening when they went to scale is that their growth slowed, and churn increased.
Why?
Because they only had Product-Market Fit and Go-To-Market Fit in a smaller slice than they thought.
When they looked under the hood and split up their company by size of customer, and how they went after them, be it through inbound, outbound, or partnerships, they actually only had product and go-to-market fit in a specific segment. For example, they really only knew how to sell to Mid Market companies, through Inbound demand gen, everything else was broken.
Find out where you’re ready for scale and where you need to run experiments in order to get to $100M

Triple down in what you know how to do (in this example Inbound Mid Market sales), and then set up a couple of cross-functional experiment teams, keep them small, and help them figure out how to sell the Enterprise / get the outbound motion cranking etc… while checking off product-market fit and go-to-market fit as you go. Then scale when you have each slice figured out.
🤩 Sales and Marketing Alignment
90% of customers start their buying journey in a domain owned by marketing and they progress into a domain owned by sales
It goes without saying, if your marketing and sales teams don’t get along, it’s the kiss of death for your company.

When it comes to designing your marketing SLA, Mark suggests you create a matrix to map out your quality of customer on one side, and engagement on the other.
The quality of customers could be based on company size, and Engagement levels could be based on things like newsletter sign-ups, content downloads, and demo requests (as shown in the above diagram).
Then you can put prices in this matrix. You can get these numbers by multiplying the close rate number multiplied how much they spent.
E.G. In the above example a $10 value was reached for the C-C block in the matrix by multiplying the close rate of 10% (0.10) by the average deal size of $100.
Marketing is now on a revenue quota.
How much lead value do they need to be creating on a monthly basis to support your sales team?
Instead of asking your marketing team to generate 500 leads a month which could be generated at a low level of quality leads such as new email newsletter subscribers, you can now ask them to generate $500,000 worth of lead value a month and they can reach it in whatever way they like by following the above SLA matrix.
Sales does not get off the hook
Calculate the path to making the most money at your company for your sales reps.
How you can do this is by mapping out the ideal number of sales attempts for each type of lead that marketing generates by running reports on your CRM data, and then build that data into your systems through a Do Not Be On It Chart.
A sales rep should follow the SLA rules and if they don’t their name populates and shows they’re not following the SLA.

The chart above went out to the whole team at HubSpot back in the day, and Mark didn’t have to wait until the end of the quarter to figure out if things were broken.
With this Sales and Marketing SLA you can measure and monitor the heartbeat of your go-to-market on a daily basis.
🤔 How To Hire Your Ideal Sales Rep
The ideal sales hiring formula is different for every company…but the process to engineer the formula is the same.
First, create a candidate assessment for when you’re interviewing potential reps based on the characteristics you want to see in an individual and weight accordingly. Iterate as your witness people doing well / not well while with the company.
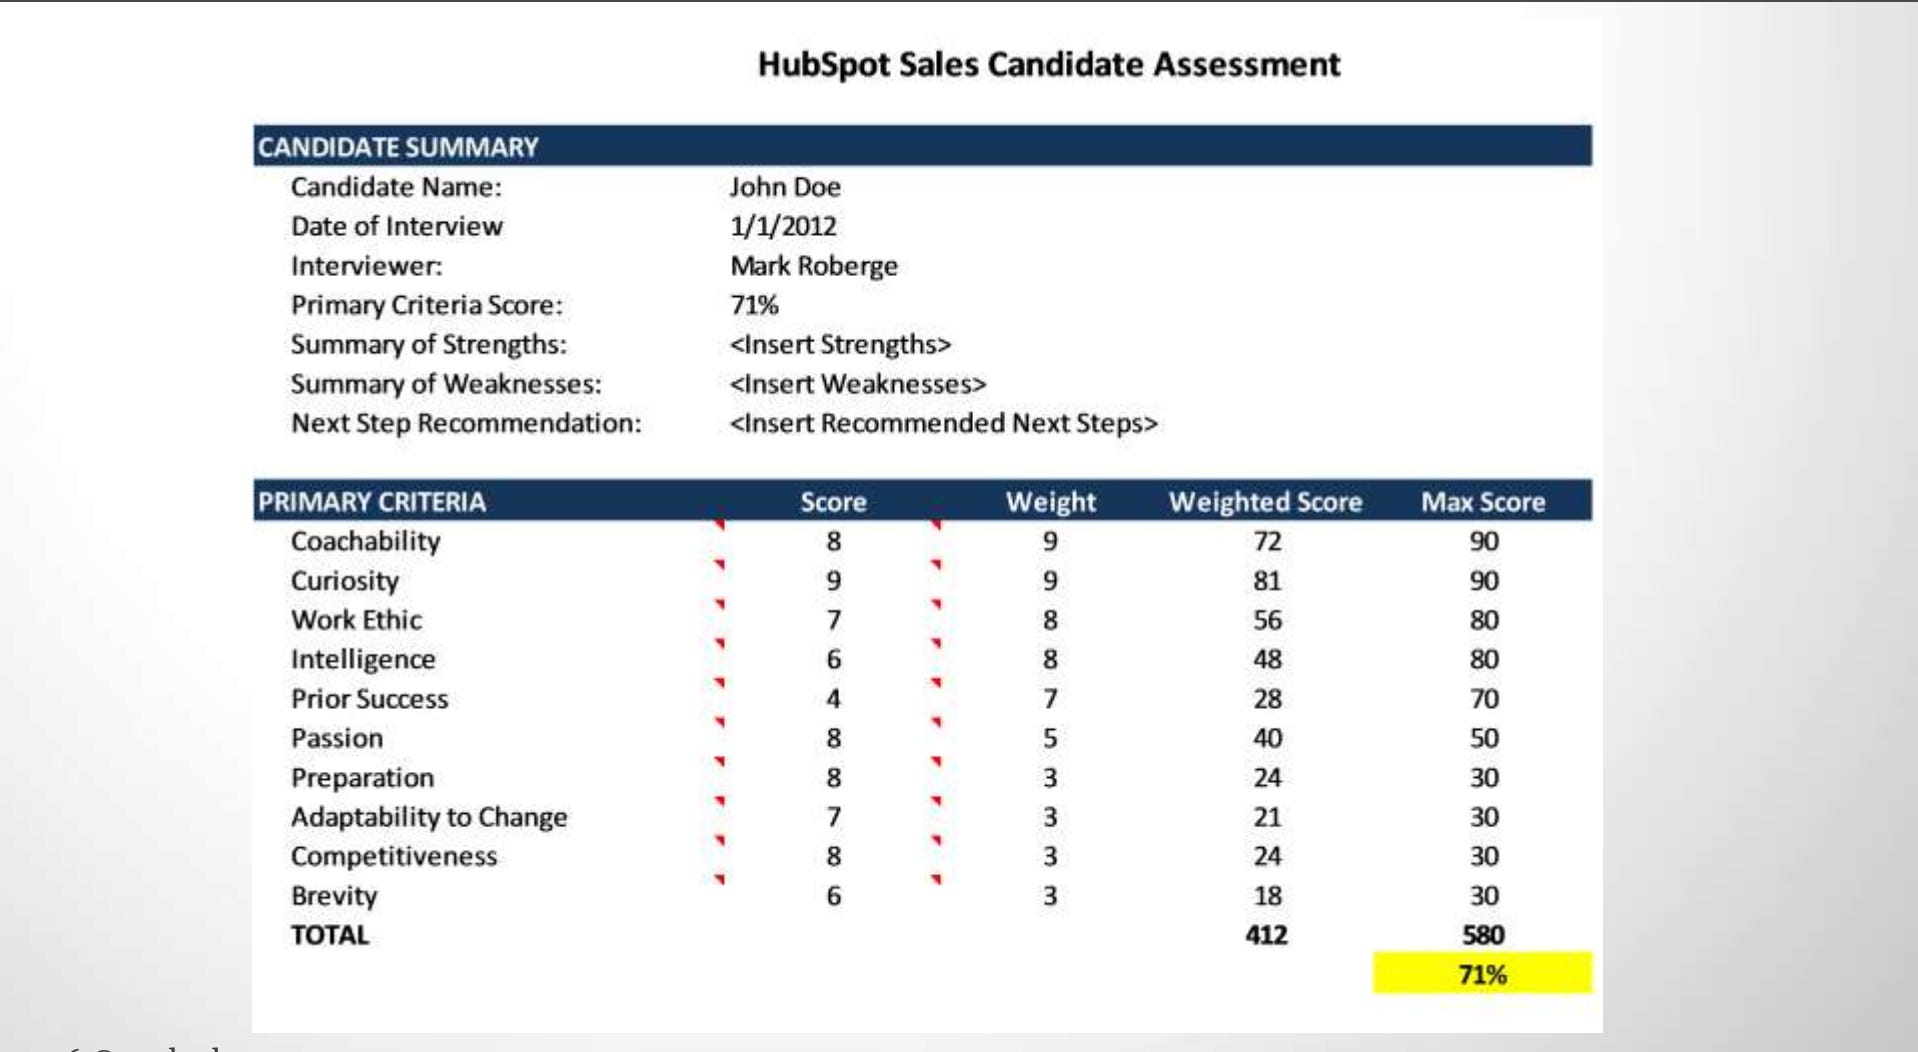
Over time, once you’ve hired 20 / 30 people, you can run a regression analysis to show which of those characteristics you were interviewing for actually have a correlation with a rep’s success in the company or not.
In HubSpot’s case specifically, when they ran their analysis they realized that their top traits found in successful HubSpotters were alike to how you would describe a great consultant or advisor, rather than a hard-nosed car salesman. It set the tone for the team they built over the years.

In other words, set a quantitative framework and test. If a rep is doing great 6 months in, why? If a rep is doing poorly 6 months in, why didn’t you catch it at the interview process and how can you iterate to improve?
🎓 Mark’s Sales Interview Process
The following slides are pretty self-explanatory.


👀 What A Good Sales Coach Should Do
A sales manager should focus on hiring, and coaching. Not run pipeline, not do the job for the reps. If they hire and coach well, they’re going to scale.
What does a good coach look like?
It’s not the 1st time manager that sees a new rep do 50 things wrong and then proceed to throw up on them with the 50 solutions. The reps head will go spinning and they won’t improve because they won’t know where to begin.
It’s someone that might see a new rep do 50 things wrong, but will pick the 1 that is the most broken and focus there on helping them fix it before moving onto the next problem.
They understand that fixing this 1 thing will make the biggest improvement to their sales game in the shortest amount of time.
💯 Building A Data-Driven Coaching Culture
Use data to diagnose a rep’s skill deficiency and then customize a coaching plan to help them improve. In the above below the purple rep is the worst performing, they’re making a ton of calls, but have sold the least, why is that?
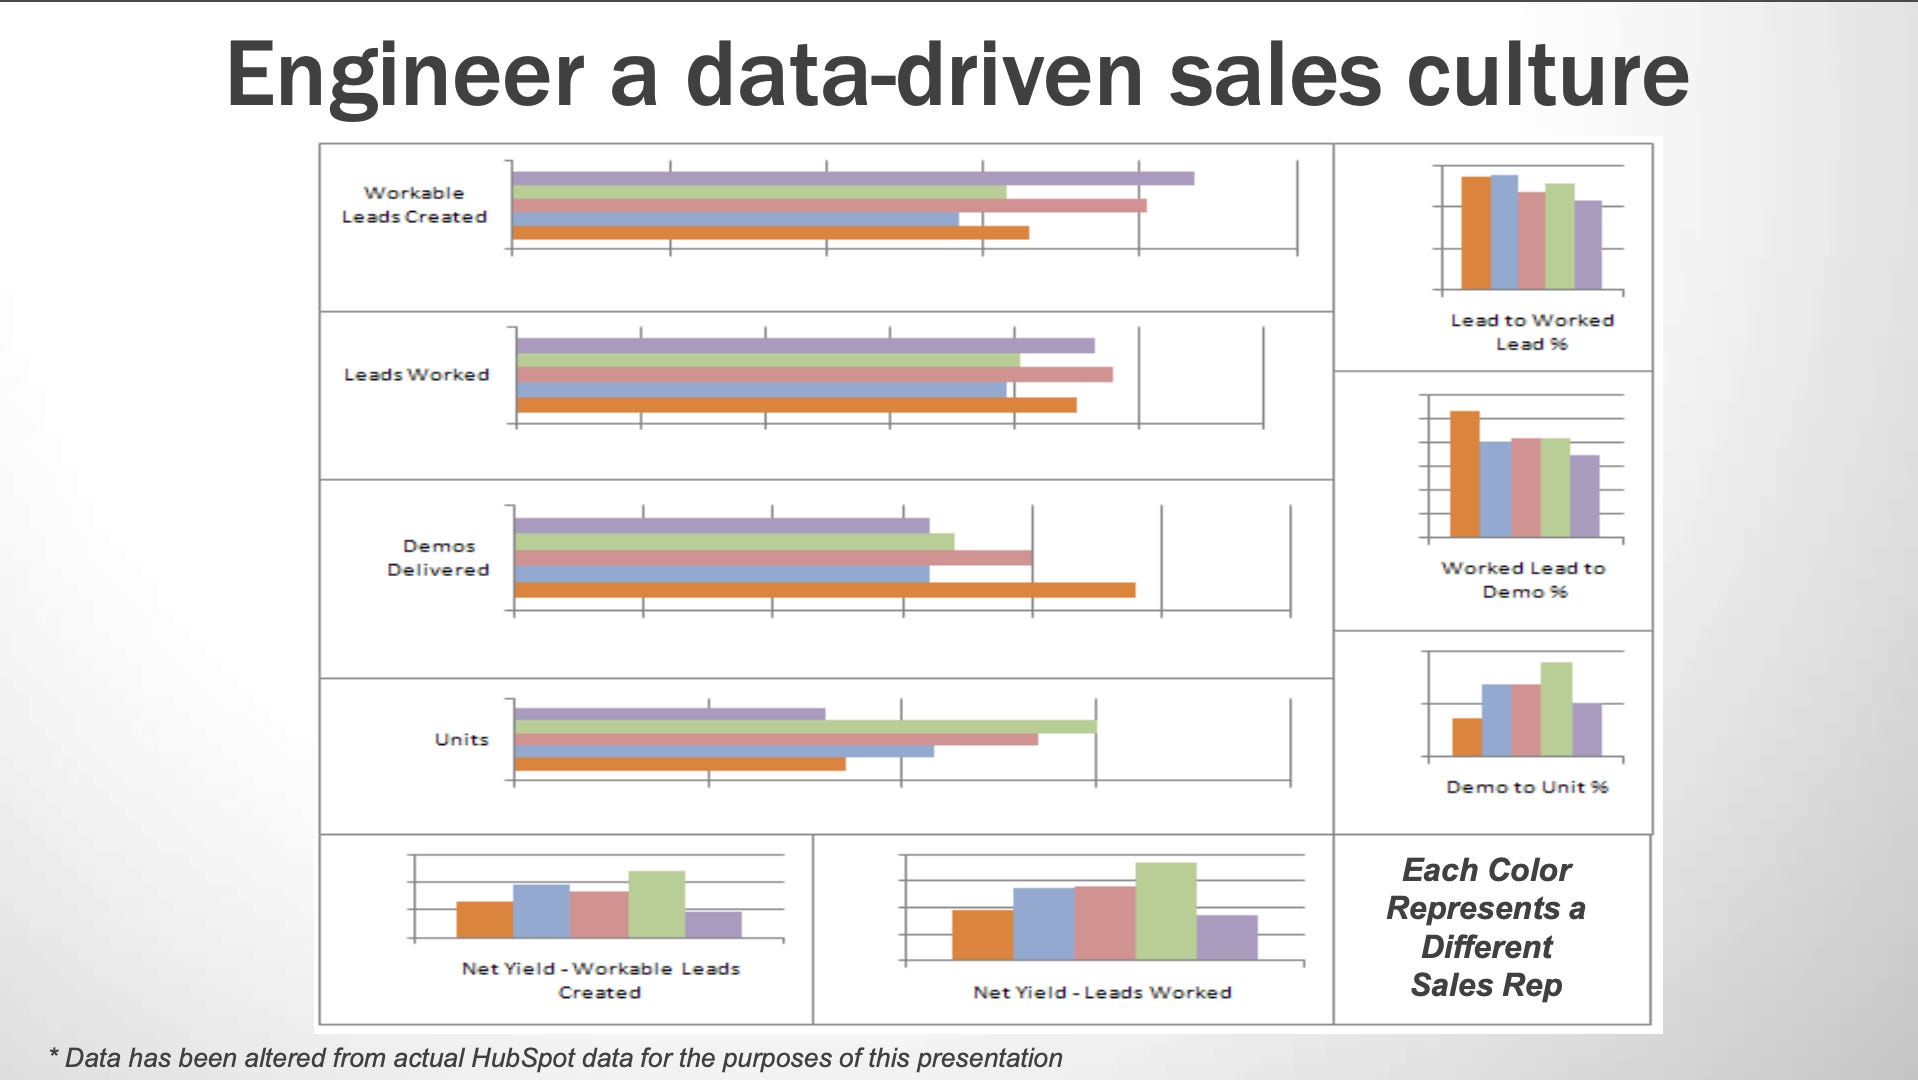
You can use the reports to diagnose where things are breaking down that need to be fixed. For example, their lead to demo conversion rates aren’t up to where they need to be to sell enough units to hit quota. A customized coaching plan focused on improving this motion would be created and put into place to help grow the business.
Once you get to the size of a big organization, you would hold the organization accountable to a data-driven coaching culture by setting up meetings between all personnel on the sales team from rep to VP at the beginning of the month to review and discuss each person’s skill/development plans.

You’d document the coaching plan for each rep to have a paper trail and measure what success looks like. Reps can be held accountable to this month over month, and managers can be held accountable if the rep doesn’t show improvement.

💰 Using Sales Compensation To Retain The Best Talent
We’re losing reps too quickly.
The average tenure for a sales rep in a company is 2.2 years
For a role where success and failure is so quantifiable. Why do so many companies look to compensate their reps so subjectively?
You can’t walk into an engineering team and be able to point out your best engineer by 7%, but in sales you can.
So why do we comp our reps on an annual raise of 3%?
Mark cut out the whole subjectivity around promotions in sales when he was at HubSpot. When you came in at a certain level, you got the same compensation as the other person that got hired into that position. In order to get promoted and advance to the next role, you needed to hit certain requirements.
It could take one rep 6 months to hit those requirements, it could take a different rep 20 months. Once hit, you got a new title with a compensation package that was transparent throughout the company and a new set of requirements to hit to get promoted again.

On a personal note, I can attest to this compensation model working pretty well. I’ve had a taste of both the subjective annual raise, and the clearly built out promotion path at HubSpot and I’d pick the latter every time. It helps keeps motivation levels high to be consistently successful month to month and you’re not in the dark about what needs to get achieved. There are reps at HubSpot I personally know that have been there for years, and seem to have no plans to move on to a new company.
Here’s a pretty neat visual Mark has at the end of his presentation that provides us with a birds-eye view on everything you need to go from experiment to scale.